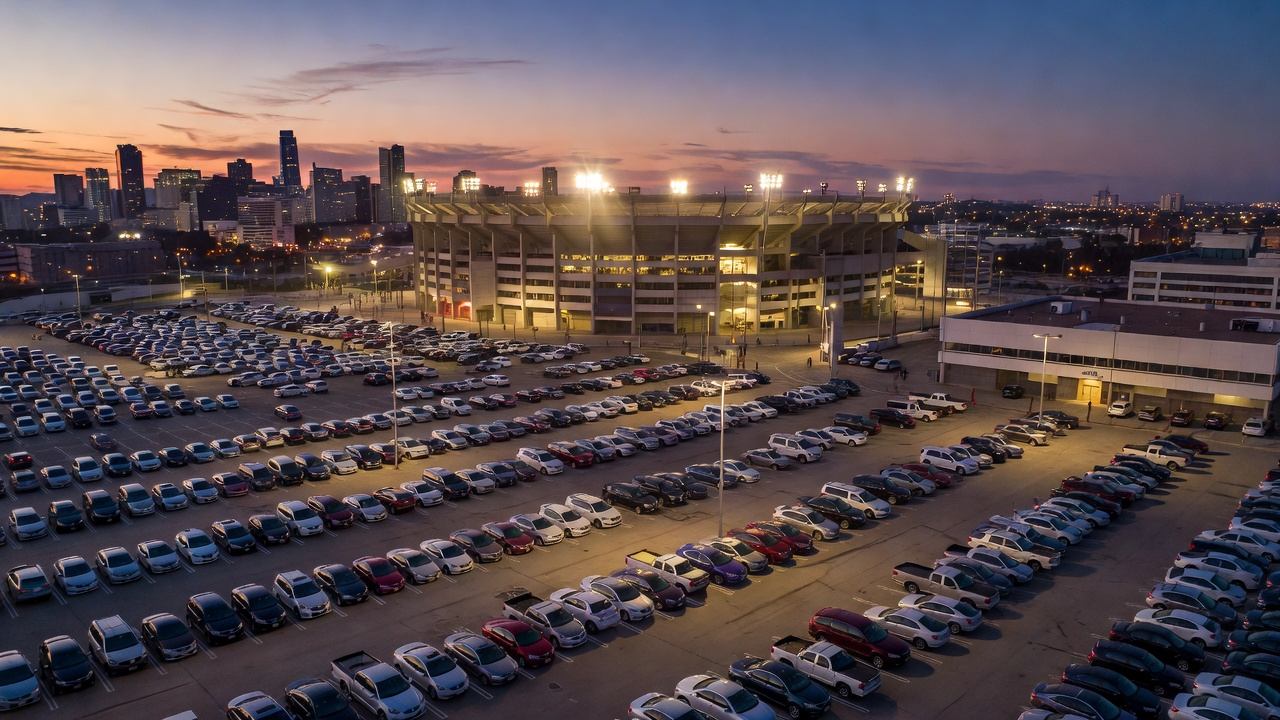
Event parking is the highest-variance revenue category in the operator toolkit. A 500-space surface lot adjacent to a 20,000-seat arena can generate more revenue on a single sold-out Saturday night than it collects during four weeks of daily transient operations. That upside makes the asset class attractive. The benchmarks, however, are rarely published with enough specificity to be useful — so operators either rely on vendor case studies or set expectations based on gut feel.
This piece consolidates what the available data actually shows across venue categories, with realistic per-space yield ranges and the factors that explain variance within each type.
What the Revenue Data Shows by Venue Type
Stadium and Arena Adjacent (Major Venues)
Major stadium facilities — NFL, MLB, NBA, NHL, MLS — represent the top of the event parking benchmark range. The revenue profile is heavily concentrated: a 70,000-seat NFL stadium typically hosts 10–12 home games per year plus concerts and playoff events, meaning most of the annual parking revenue arrives across 15–20 event days.
Published figures for major stadium parking operations show per-event gross revenue ranging from $3.5 million (mid-market NFL markets) to over $10 million (premium markets, playoff configurations). Per-space yields on event days for lots within a half-mile of the venue commonly run $30–$75 for surface lots and $40–$90 for structured inventory, depending on pre-sale penetration and event tier.
For facilities earning $50–$75 per space on 15 major events annually, the event-day revenue contribution works out to $750–$1,125 per space per year from events alone. Combined with daily transient and monthly revenue, well-positioned stadium-adjacent facilities in major markets can generate total annual RevPAS of $4,000–$8,000 per space.
Amphitheaters and Concert Venues
Amphitheater adjacent operations have a different revenue profile: higher event frequency (70–100 events per season for major venues), lower per-event rates, and strong pre-sale dynamics. Published analysis of amphitheater parking operations shows annual gross revenue in the $1.9M–$8.2M range for venue-owned or contracted operations across 200–600 spaces, implying per-space annual event revenue of $6,000–$15,000 for operators near major amphitheaters with full-season utilization.
Pre-sale penetration matters significantly here. Operators who integrate with Ticketmaster’s parking add-on platform or SpotHero’s event module typically report 40–60% of event revenue captured via pre-sale — which reduces day-of staffing requirements and floors revenue even when walk-up demand underperforms.
Mid-Market Event Venues (5,000–20,000 Seats)
Minor-league baseball, AHL hockey, mid-size amphitheaters, convention centers, and university athletic facilities represent the broadest and most variable segment. Event-day rates commonly run $15–$40. Event frequency varies from 15 to 80+ events per year depending on venue type.
Operators in this tier who run event pricing actively — adjusting rates based on event tier, opponent, day of week, and pre-sale behavior — consistently outperform flat-rate operators by 20–35% on revenue per event day, based on operator-reported data cited in IPMI case studies.
Smaller Venues and Mixed-Use Event Programming
Conference hotels, performing arts centers, and entertainment districts with occasional large events don’t fit neatly into the dedicated event parking benchmark. Revenue per event day is lower ($12–$25 per space for most secondary events), but the margin profile can be strong if the parking infrastructure is already in place for daily operations and event revenue is incremental.
What Drives Variance Within Benchmark Ranges
Within any venue category, the spread between low-end and high-end per-space yields is substantial. Three factors explain most of it.
Pre-Sale Penetration vs. Gate-Only Operations
Facilities that actively participate in pre-sale platforms — either through direct integration with ticketing systems or via third-party reservation platforms — consistently capture more revenue per space. The mechanism is twofold: pre-sale revenue is collected at full rate with no discount for gate-rush behavior, and pre-sold spaces allow operators to yield remaining inventory at premium prices closer to the event.
Operators running gate-only operations leave 20–40% of potential revenue unrealized on high-demand events, primarily because they price defensively at the gate to move volume and can’t effectively charge premium rates when demand is highest.
Pricing Strategy by Event Tier
Not all events within the same venue generate equivalent demand for parking. A playoff game or major concert generates materially higher willingness-to-pay than a midweek regular-season game. Operators who apply a flat rate across all events leave money on the table during high-demand events while potentially over-pricing for low-demand ones.
Event-tiered pricing — at minimum segmenting events into two or three rate tiers based on expected demand — is the single highest-impact pricing decision most event-adjacent operators can make. The implementation doesn’t require sophisticated technology: it requires a rate schedule with clear event-classification rules applied consistently.
Distance from Venue Entrance
Proximity to the venue entrance is the most durable predictor of event-day premium capture. Lots within a five-minute walk of the primary entrance command rates 30–60% higher than those requiring a 10–15 minute walk or shuttle. The gradient is steeper for concerts and playoffs (where convenience premium is high) than for regular-season games (where value-seekers are more prevalent).
The Staffing Cost Problem in Event Parking RevPAS
Gross revenue benchmarks for event parking are misleading without cost context. Event parking is labor-intensive: directing traffic, processing payments, and managing lot entry and exit at scale requires staff ratios that don’t exist in daily transient operations.
Operators who benchmark per-space revenue without netting out event-specific labor and operating costs systematically overstate the revenue value of event assets relative to daily operations. A more useful operating metric is net revenue per event-day per space — gross event revenue minus event-specific labor and operating costs, divided by spaces deployed.
Well-run operations in major markets typically achieve net event-day revenue of $18–$45 per space on peak events. This is still significantly higher than typical daily transient net revenue per space, but it’s a more accurate picture of the business case for maintaining or acquiring event-adjacent inventory.
Connecting Event Benchmarks to Annual RevPAS
The value of event parking assets depends heavily on the non-event revenue base. A surface lot with 60 event days per year generating $40 net per space per event contributes $2,400 per space annually from events. If the same lot generates $1,200/space from daily transient operations during non-event days, total annual RevPAS is $3,600 — putting it in the upper quartile of surface lot national benchmarks.
Facilities that optimize both the event revenue layer and the daily operations layer consistently outperform single-channel operations. The operators who treat event programming as a separate revenue line with its own rate strategy, pre-sale infrastructure, and staffing model — rather than as an extension of daily transient operations — show the most durable above-benchmark performance.
The data supports investing in event-specific pricing infrastructure for any facility within a practical walk of a venue hosting 20 or more events annually. Below that threshold, the operational overhead of running a differentiated event program typically doesn’t justify the return relative to setting a flat event premium and managing execution through daily operations staffing.